I love infographics! I actually collect them in a folder on my hard drive. I have a chat room where my friends and I share them.
One of the great moments in history of infogaphics is the story of Florence Nightingale’s Coxcomb. She wasn’t the first to create an infographic, but she was arguably the first to use an infographic to change policy.
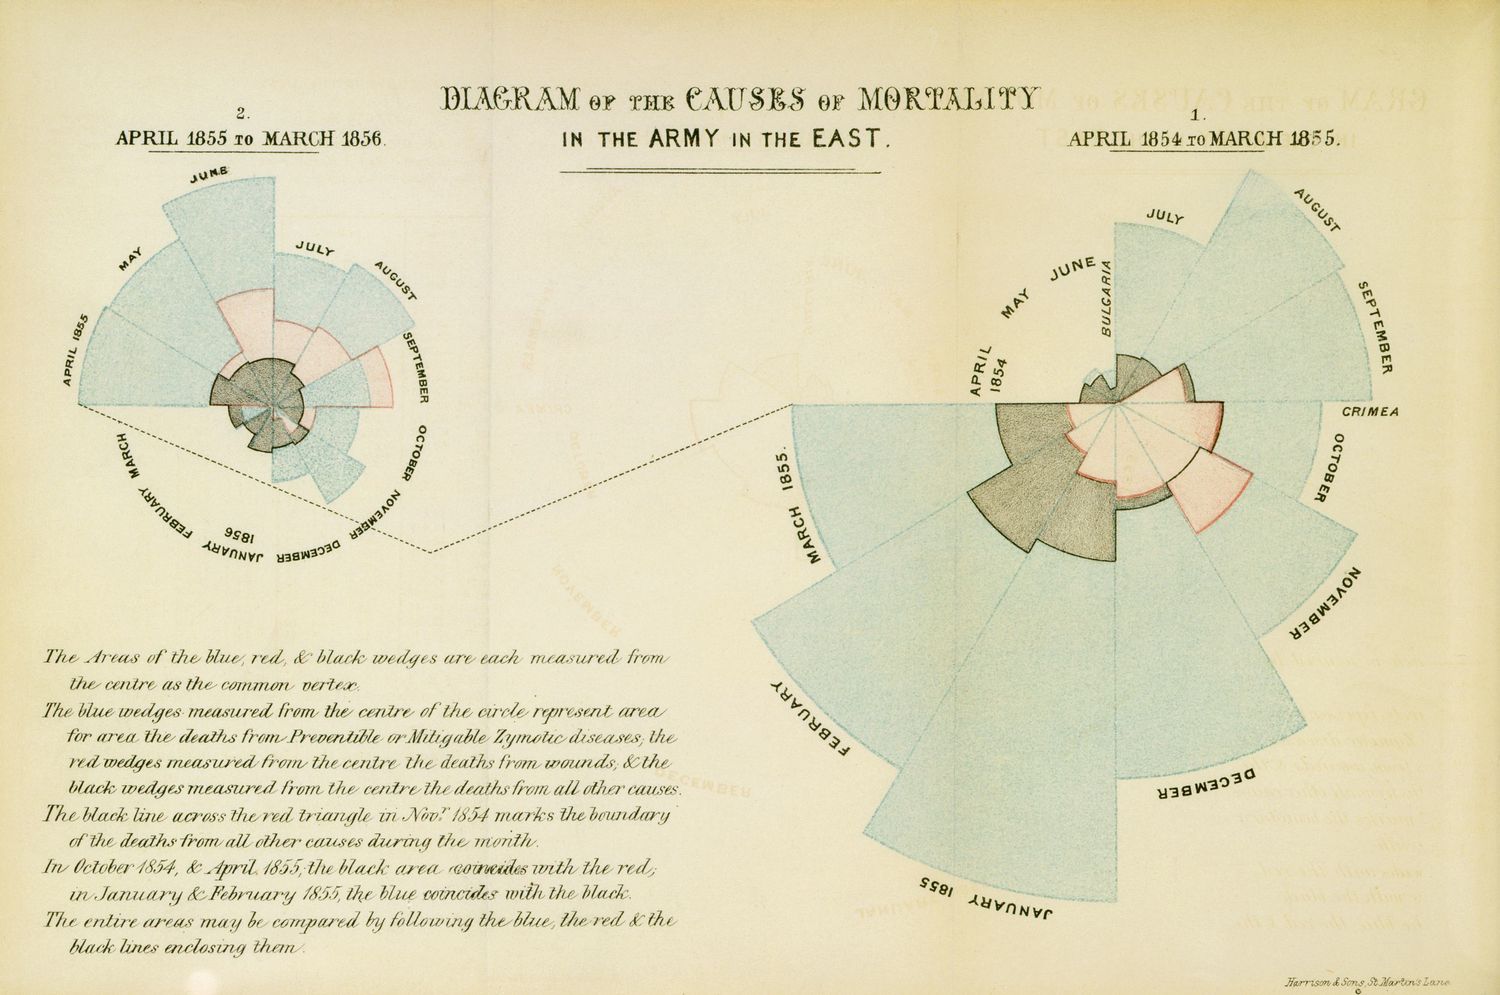
She included this graph in her report to the army to convince them of the effectiveness of sanitization in saving lives in the Crimerian war. She gave her innovative graph the name coxcomb. Luckily for us, she got some pushback from the army which convinced her to leak the image to the press. Otherwise we may have never known of this beautiful graph because it could’ve been a classifieds military secret.